Match Predictor Page
The Match Predictor page can be accessed by clicking on the brain icon on a match from the Match Schedules page. It displays estimated scores, roles and other information about the match, as well as an estimated percent chance of each alliance winning the match.
Match Predictor Calculations
To find win percentage, the app first generates an alliance’s score distribution from each of the three teams’ point averages and standard deviations using the equations:
After plugging these values into the formula for a normal distribution’s probability density function (PDF), the conversion of team point distributions to one alliance point distribution might look like this:
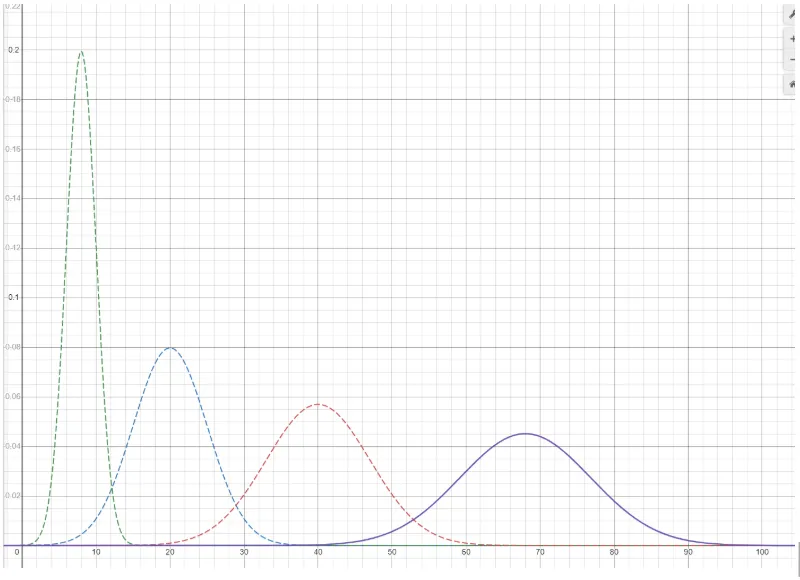
Teams’ point distributions are dashed and the alliance distribution is purple. The graph’s x-axis represents the number of points scored in a game and the y-axis represents the relative frequencies (probability density) with which each point outcome occurs.
After each alliance’s point distributions are found, one distribution can be subtracted from the other to get the mean and standard deviation for a distribution of the two alliance’s point differential:
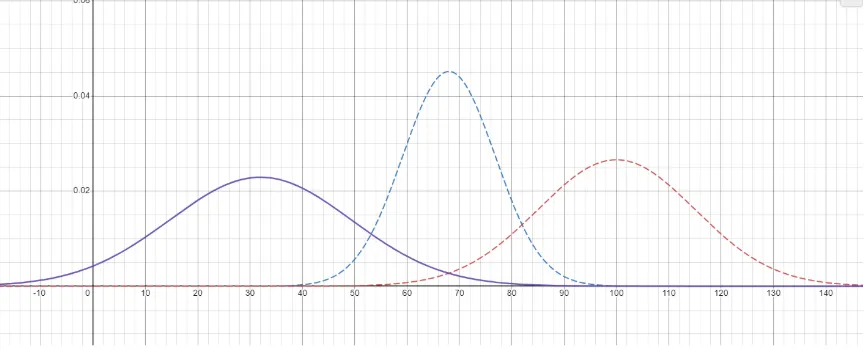
This is how that might look on a graph, where the purple graph is the distribution of Red Alliance Points minus Blue Alliance Points.
Any point to the right of the y-axis on this point differential distribution represents a red win (because red points - blue points is positive), and any point to the left is a blue win (because red points - blue points is negative in that case.) To find the probability that blue will win (or that red loses) one can find the area under the graph to the left of the y-axis, or the integral from negative infinity to zero.
This looks like:
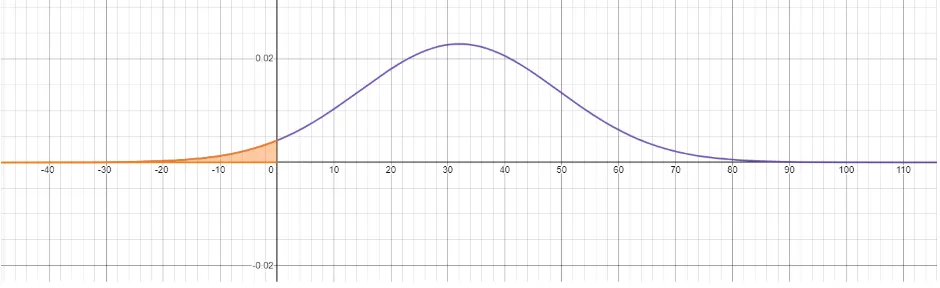
Compute this, and you’d get a 3.3% chance of blue winning:
The program finds this area by determining zero’s z-score on the distribution and converting this to a p-value, which yields the same left-tailed proportion.